Welcome to my Portfolio!

"From chaos to clarity—I'm your data detective on duty!"

I’m a data analyst who turns complex data into smooth, scalable solutions. With a background in civil engineering, I approach data like a structured project—breaking it down, refining it, and building dashboards that just work.

I specialize in creating interactive Power BI reports, automating workflows, and writing clean SQL and Python to extract insights that drive smarter decisions. From tracking KPIs to streamlining reporting systems, I focus on making analytics seamless, actionable, and elegant.

Always optimizing. Always learning. Because good data isn’t just numbers—it’s clarity, confidence, and momentum.

Beyond data, I enjoy coffee, football, and exploring the latest in analytics.

Ready to unlock the full potential of your data? Let’s work together to turn your vision into measurable success!

Professional Skills

  • Power BI
  • Excel
  • SQL
  • Python

Projects

Explore some of the projects I've worked on, highlighting my ability to analyze complex datasets, create meaningful visualizations, and solve business challenges using data-driven approaches.

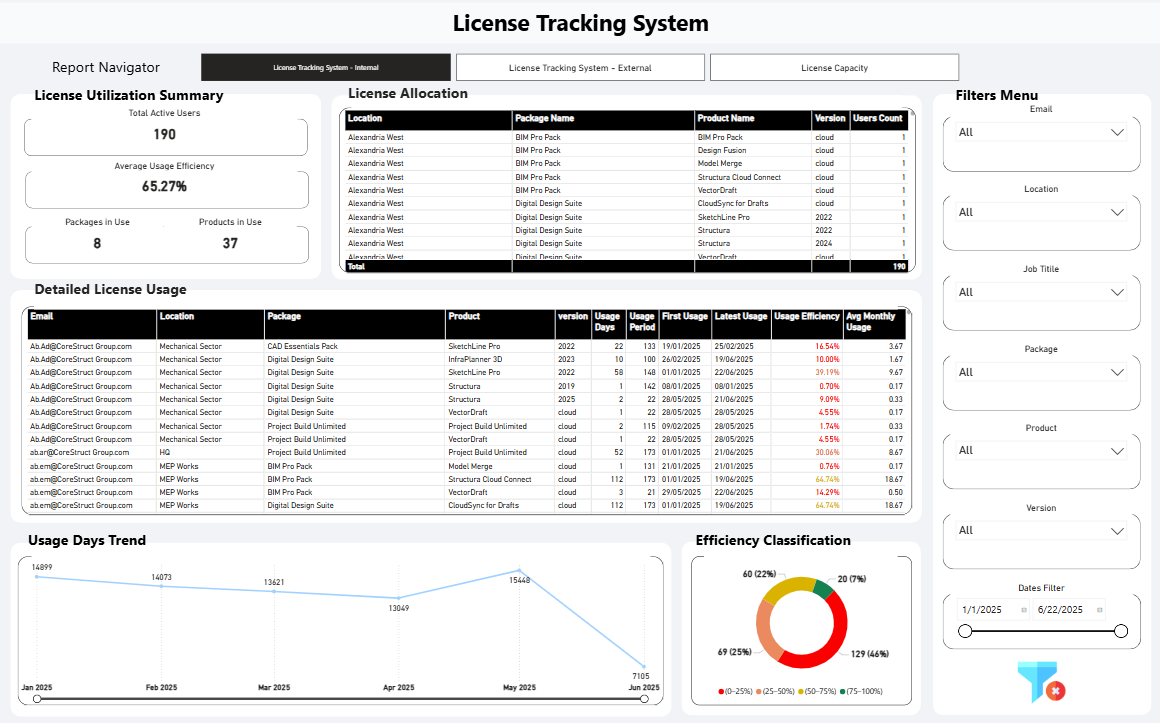
License Tracking System Solution

Developed an enterprise-level license tracking solution using Power BI, Power Automate, and SharePoint to monitor software usage across internal and external users. The system automates data collection via API and transforms raw usage logs into a live dashboard, providing real-time insights into user efficiency, license allocation, and capacity utilization. With classification visuals, dynamic filters, and usage trends, the solution supports strategic license management, reduces waste, and improves visibility for IT and business leaders.
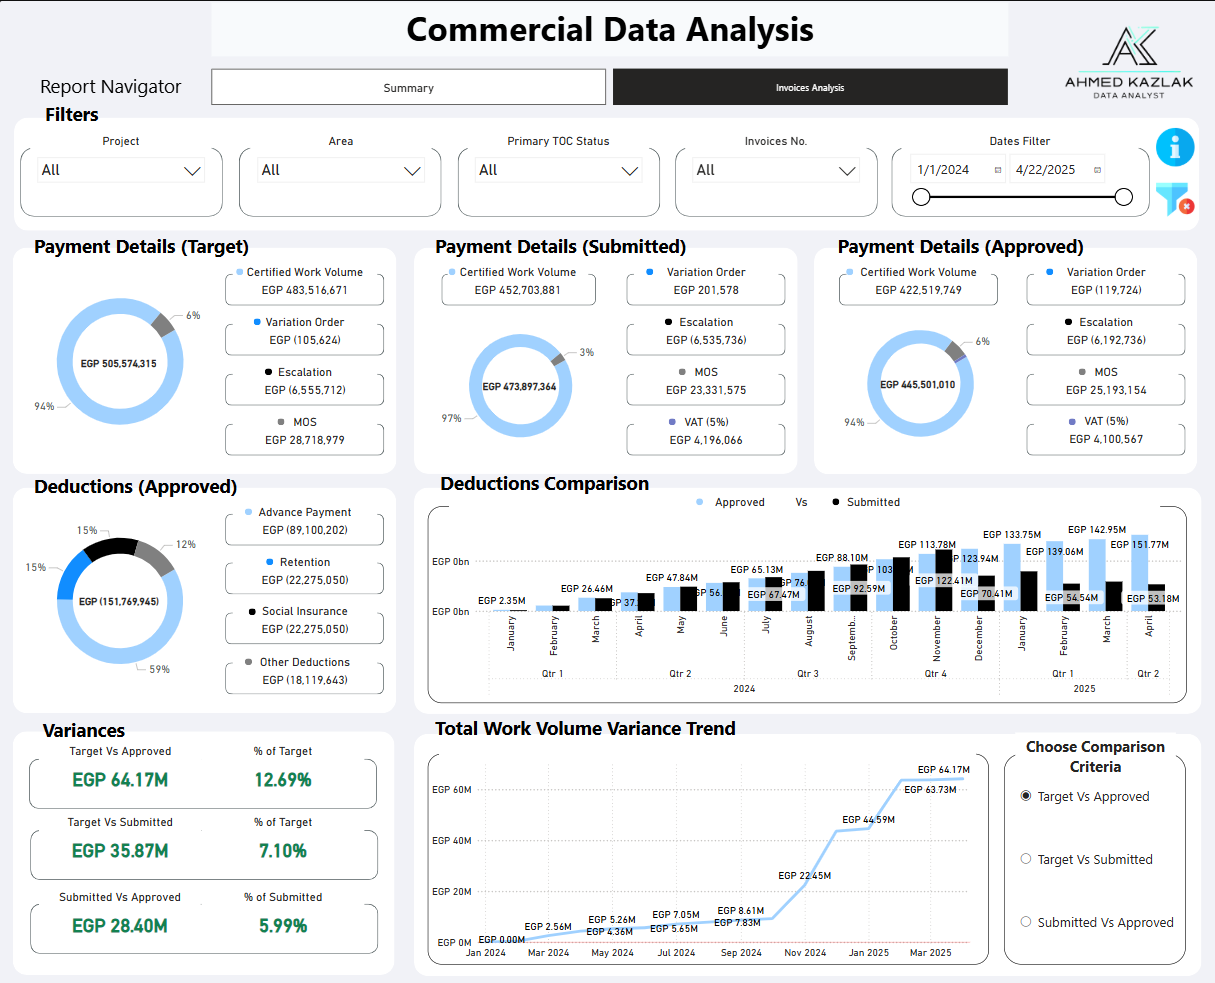
Commercial Data Analysis Solution

Developed a fully automated reporting solution for tracking invoices and commercial data in construction projects, using Power BI, Power Automate, and SharePoint. The system transforms uploaded files into a live dashboard, enabling real-time insights into submitted, approved, and target invoices, financial metrics, and deductions. With dynamic filters, visual breakdowns, tooltips, and trend analysis, the solution streamlines reporting, enhances data accuracy, and eliminates delays across project teams.

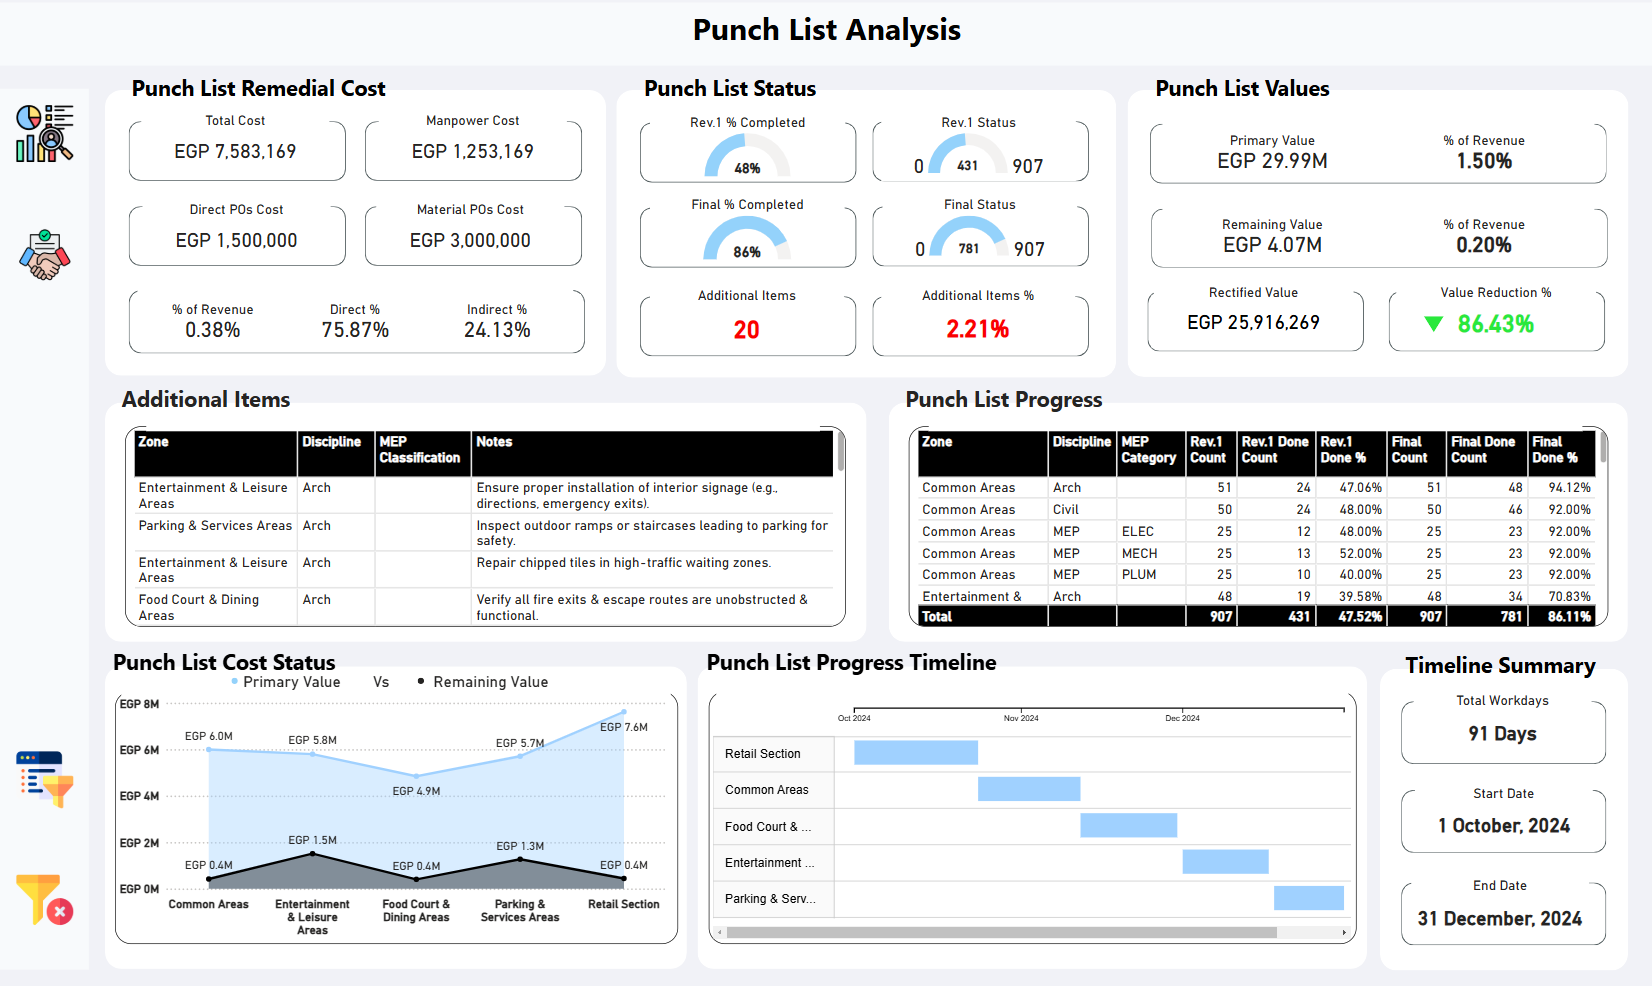
Punch List Analysis

Performed a punch List analysis for a large-scale mall project, evaluating progress and costs, resulting in EGP 26 million savings and a 347% cost efficiency. Utilized Power BI to visualize the data and provide detailed insights on rectified and remaining values.

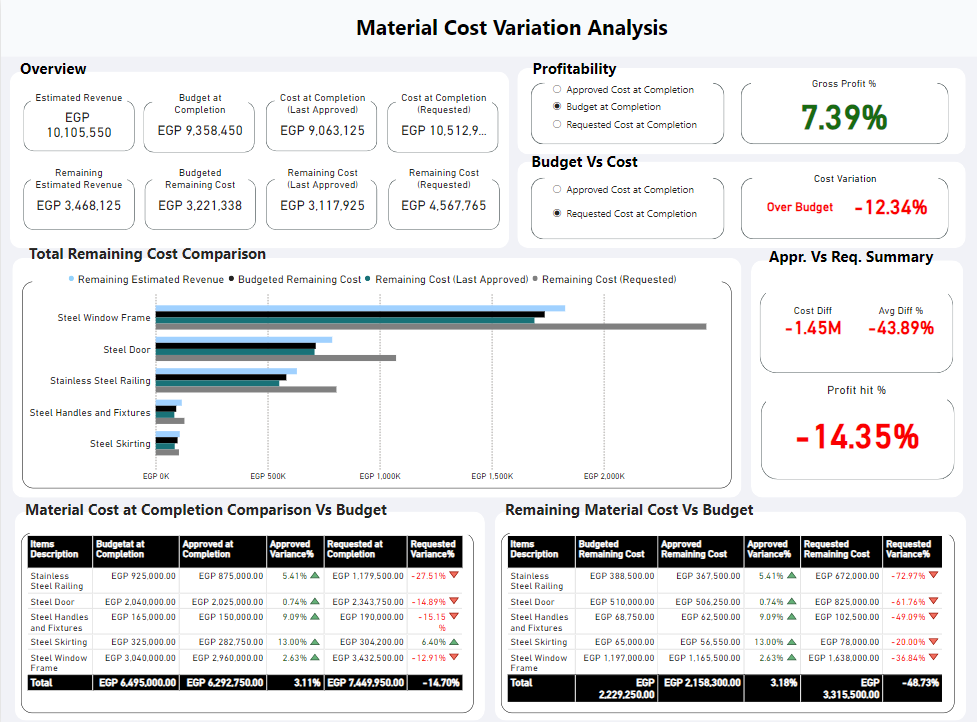
Material Cost Variation Analysis

Analyzing steel finishing material costs to compare budgets, approved costs, and subcontractor offers, highlighting variances and profit margins.

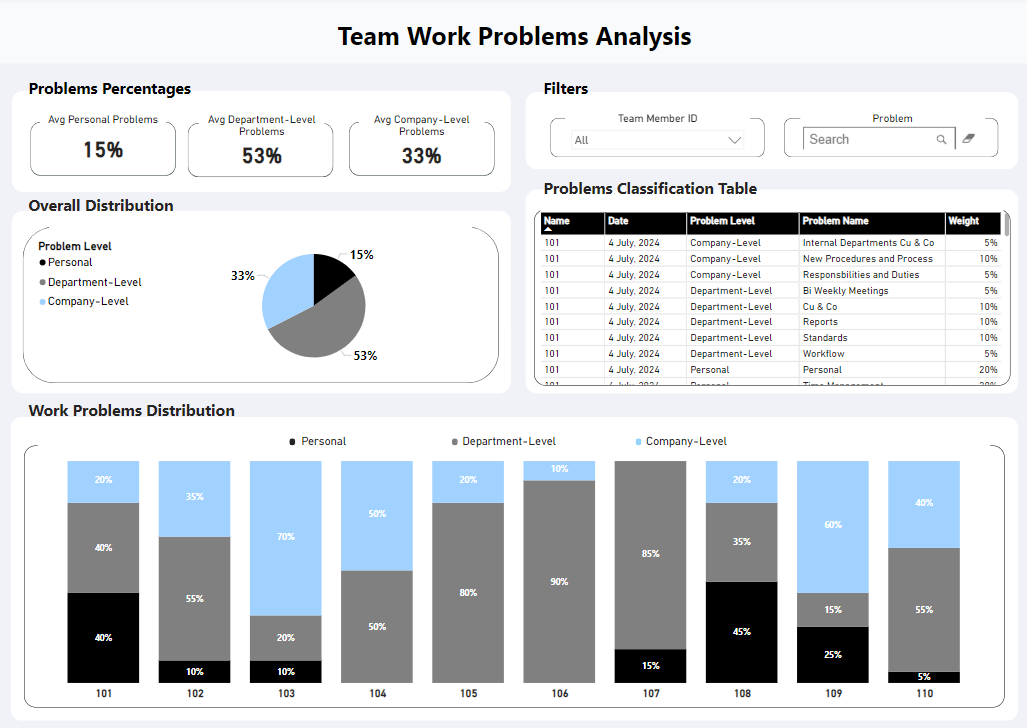
Team Work Problems Analysis

An analysis of work-related problems within a team, categorized into Personal, Departmental, and Company-wide issues. Data was collected using Excel and visualized in Power BI to identify trends and suggest improvements for better team performance.

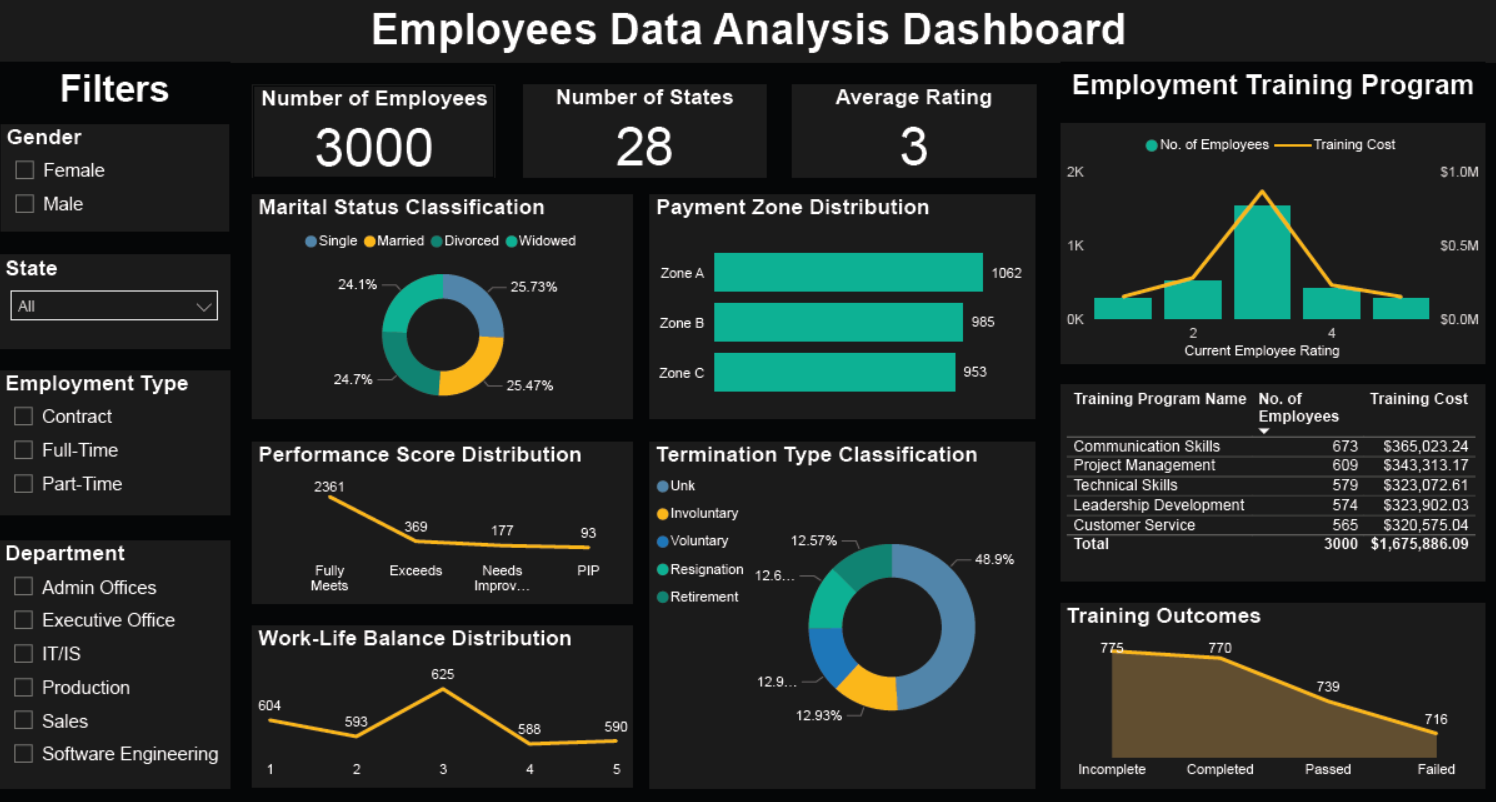
Employee Data Analysis

An analysis of employee data, focusing on factors such as marital status, payment zone, performance scores, work-life balance, termination types, and training outcomes. The project utilized Excel and Power BI to identify trends, performance patterns, and key insights for improving employee management and decision-making.

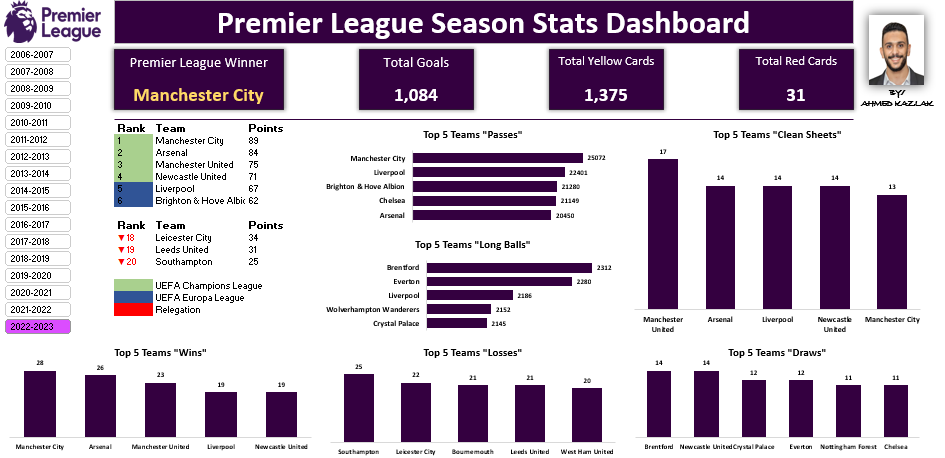
EPL Season Stats Analysis

An analysis of English Premier League (EPL) season statistics from 2006-2007 to 2022-2023. The project focused on key performance metrics, including team and player statistics, match outcomes, and trends over the seasons, using Excel for data collection and visualization.

Python Tasks

A series of Python tasks completed during an internship, focusing on data manipulation, analysis, and automation. The tasks involved using Python libraries like Pandas and NumPy to process datasets, perform calculations, and automate repetitive tasks. Additionally, I utilized Matplotlib and Seaborn to create insightful visualizations, transforming data into meaningful charts and graphs.

Certificates & Accomplishments

Explore the certifications and accomplishments that showcase my expertise in data analysis, programming, and problem-solving. These credentials reflect my commitment to continuous learning and staying at the forefront of the analytics field.

Data Storytelling

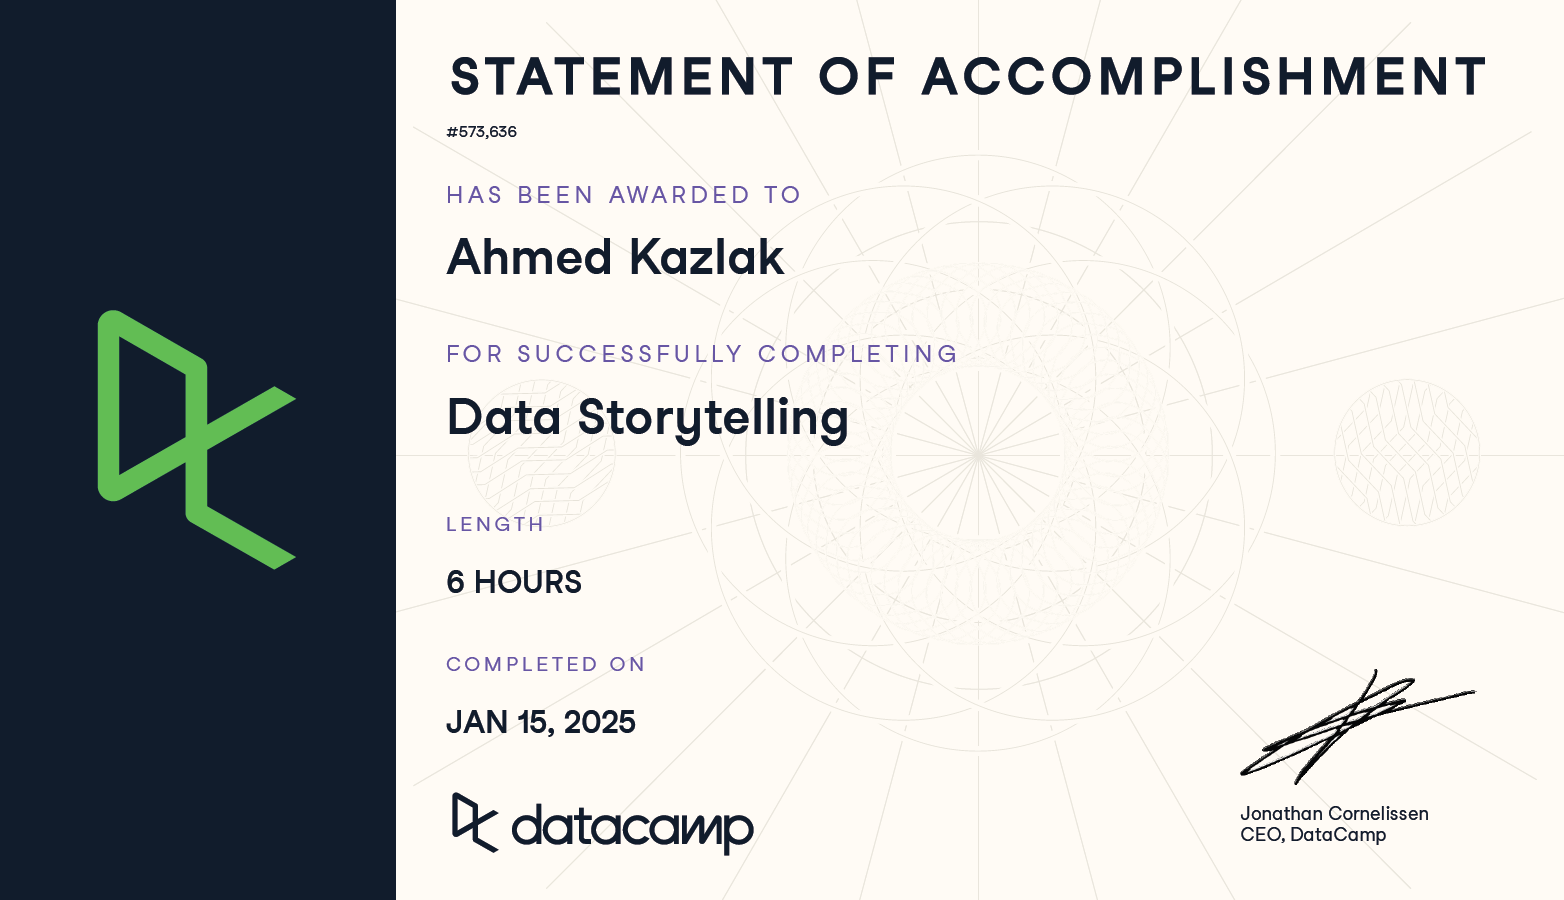
Successfully completed the Data Storytelling track on DataCamp, where I developed the ability to transform data insights into compelling narratives. I mastered techniques for designing impactful visualizations, creating engaging dashboards, and tailoring messages to diverse audiences. This track enhanced my expertise in data visualization best practices, storytelling frameworks, and crafting data-driven presentations for maximum impact.

Data Analyst in Power BI

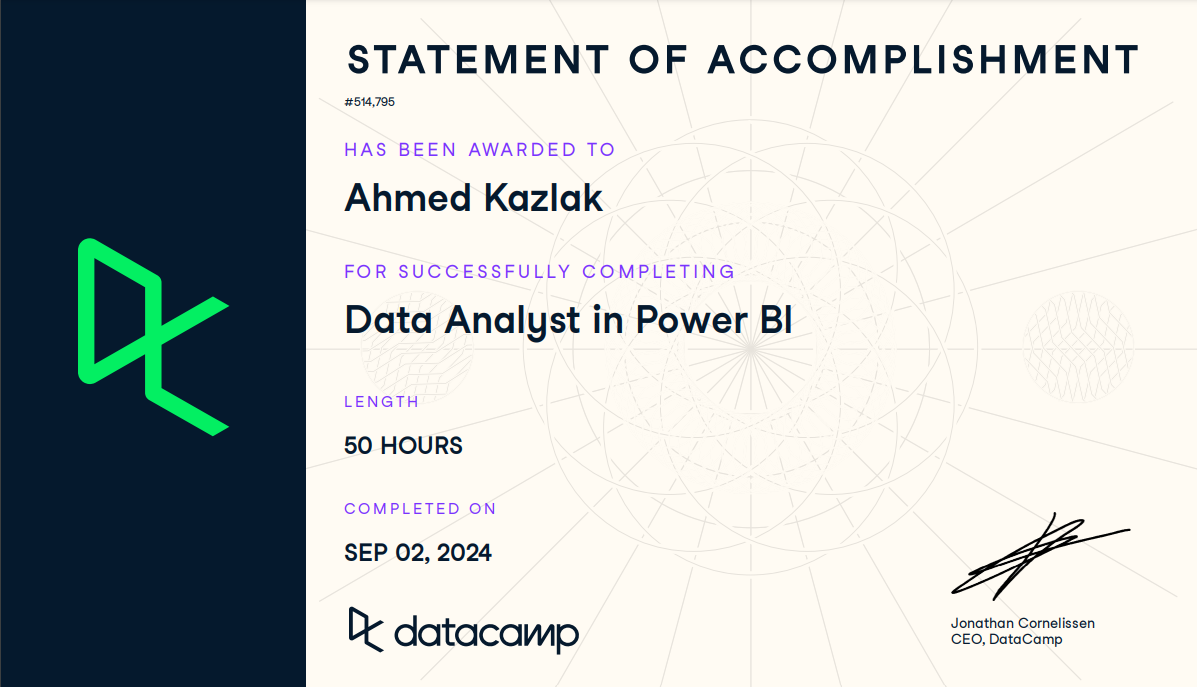
Successfully completed the Data Analyst in Power BI track on DataCamp, where I mastered the fundamentals of data analysis using Power BI, including data import, transformation, visualization, and creating dynamic reports and dashboards. This track enhanced my skills in DAX, Power Query, and advanced data modeling techniques.

Databases and SQL for Data Science with Python

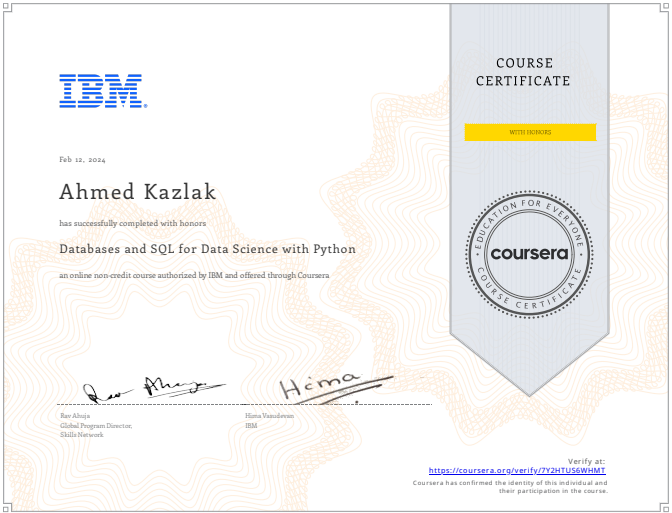
Completed the Databases and SQL for Data Science with Python course on Coursera by IBM, where I learned how to use SQL to manage and query databases for data science projects. The course covered essential SQL concepts, including data retrieval, aggregation, and filtering, and demonstrated how to integrate SQL with Python to perform data analysis and build more powerful data-driven solutions.

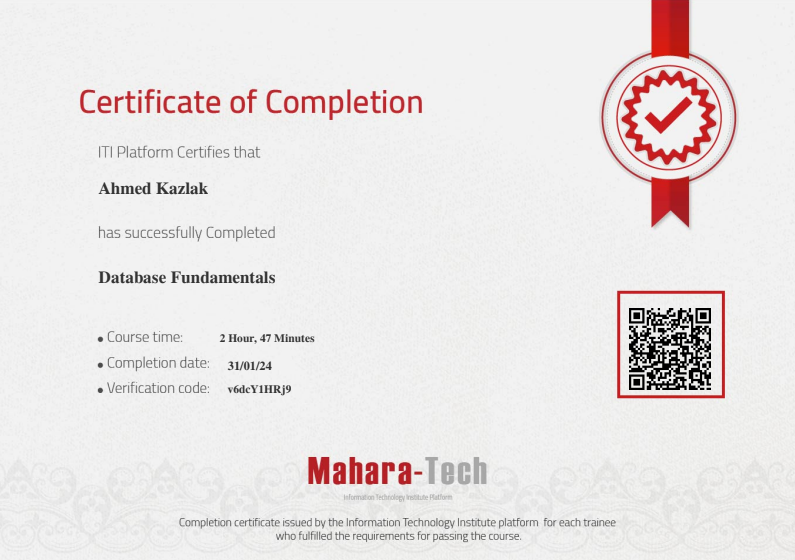
Database Fundamentals

Earned the "Database Fundamentals" certificate on Mahar-Tech, covering key database concepts and practices. The course included topics such as Entity-Relationship Diagrams (ERD), ERD mapping to tables, SQL, Data Manipulation Language (DML), SQL for other database objects, and Normalization techniques. These skills provide a strong foundation for designing, querying, and optimizing relational databases.

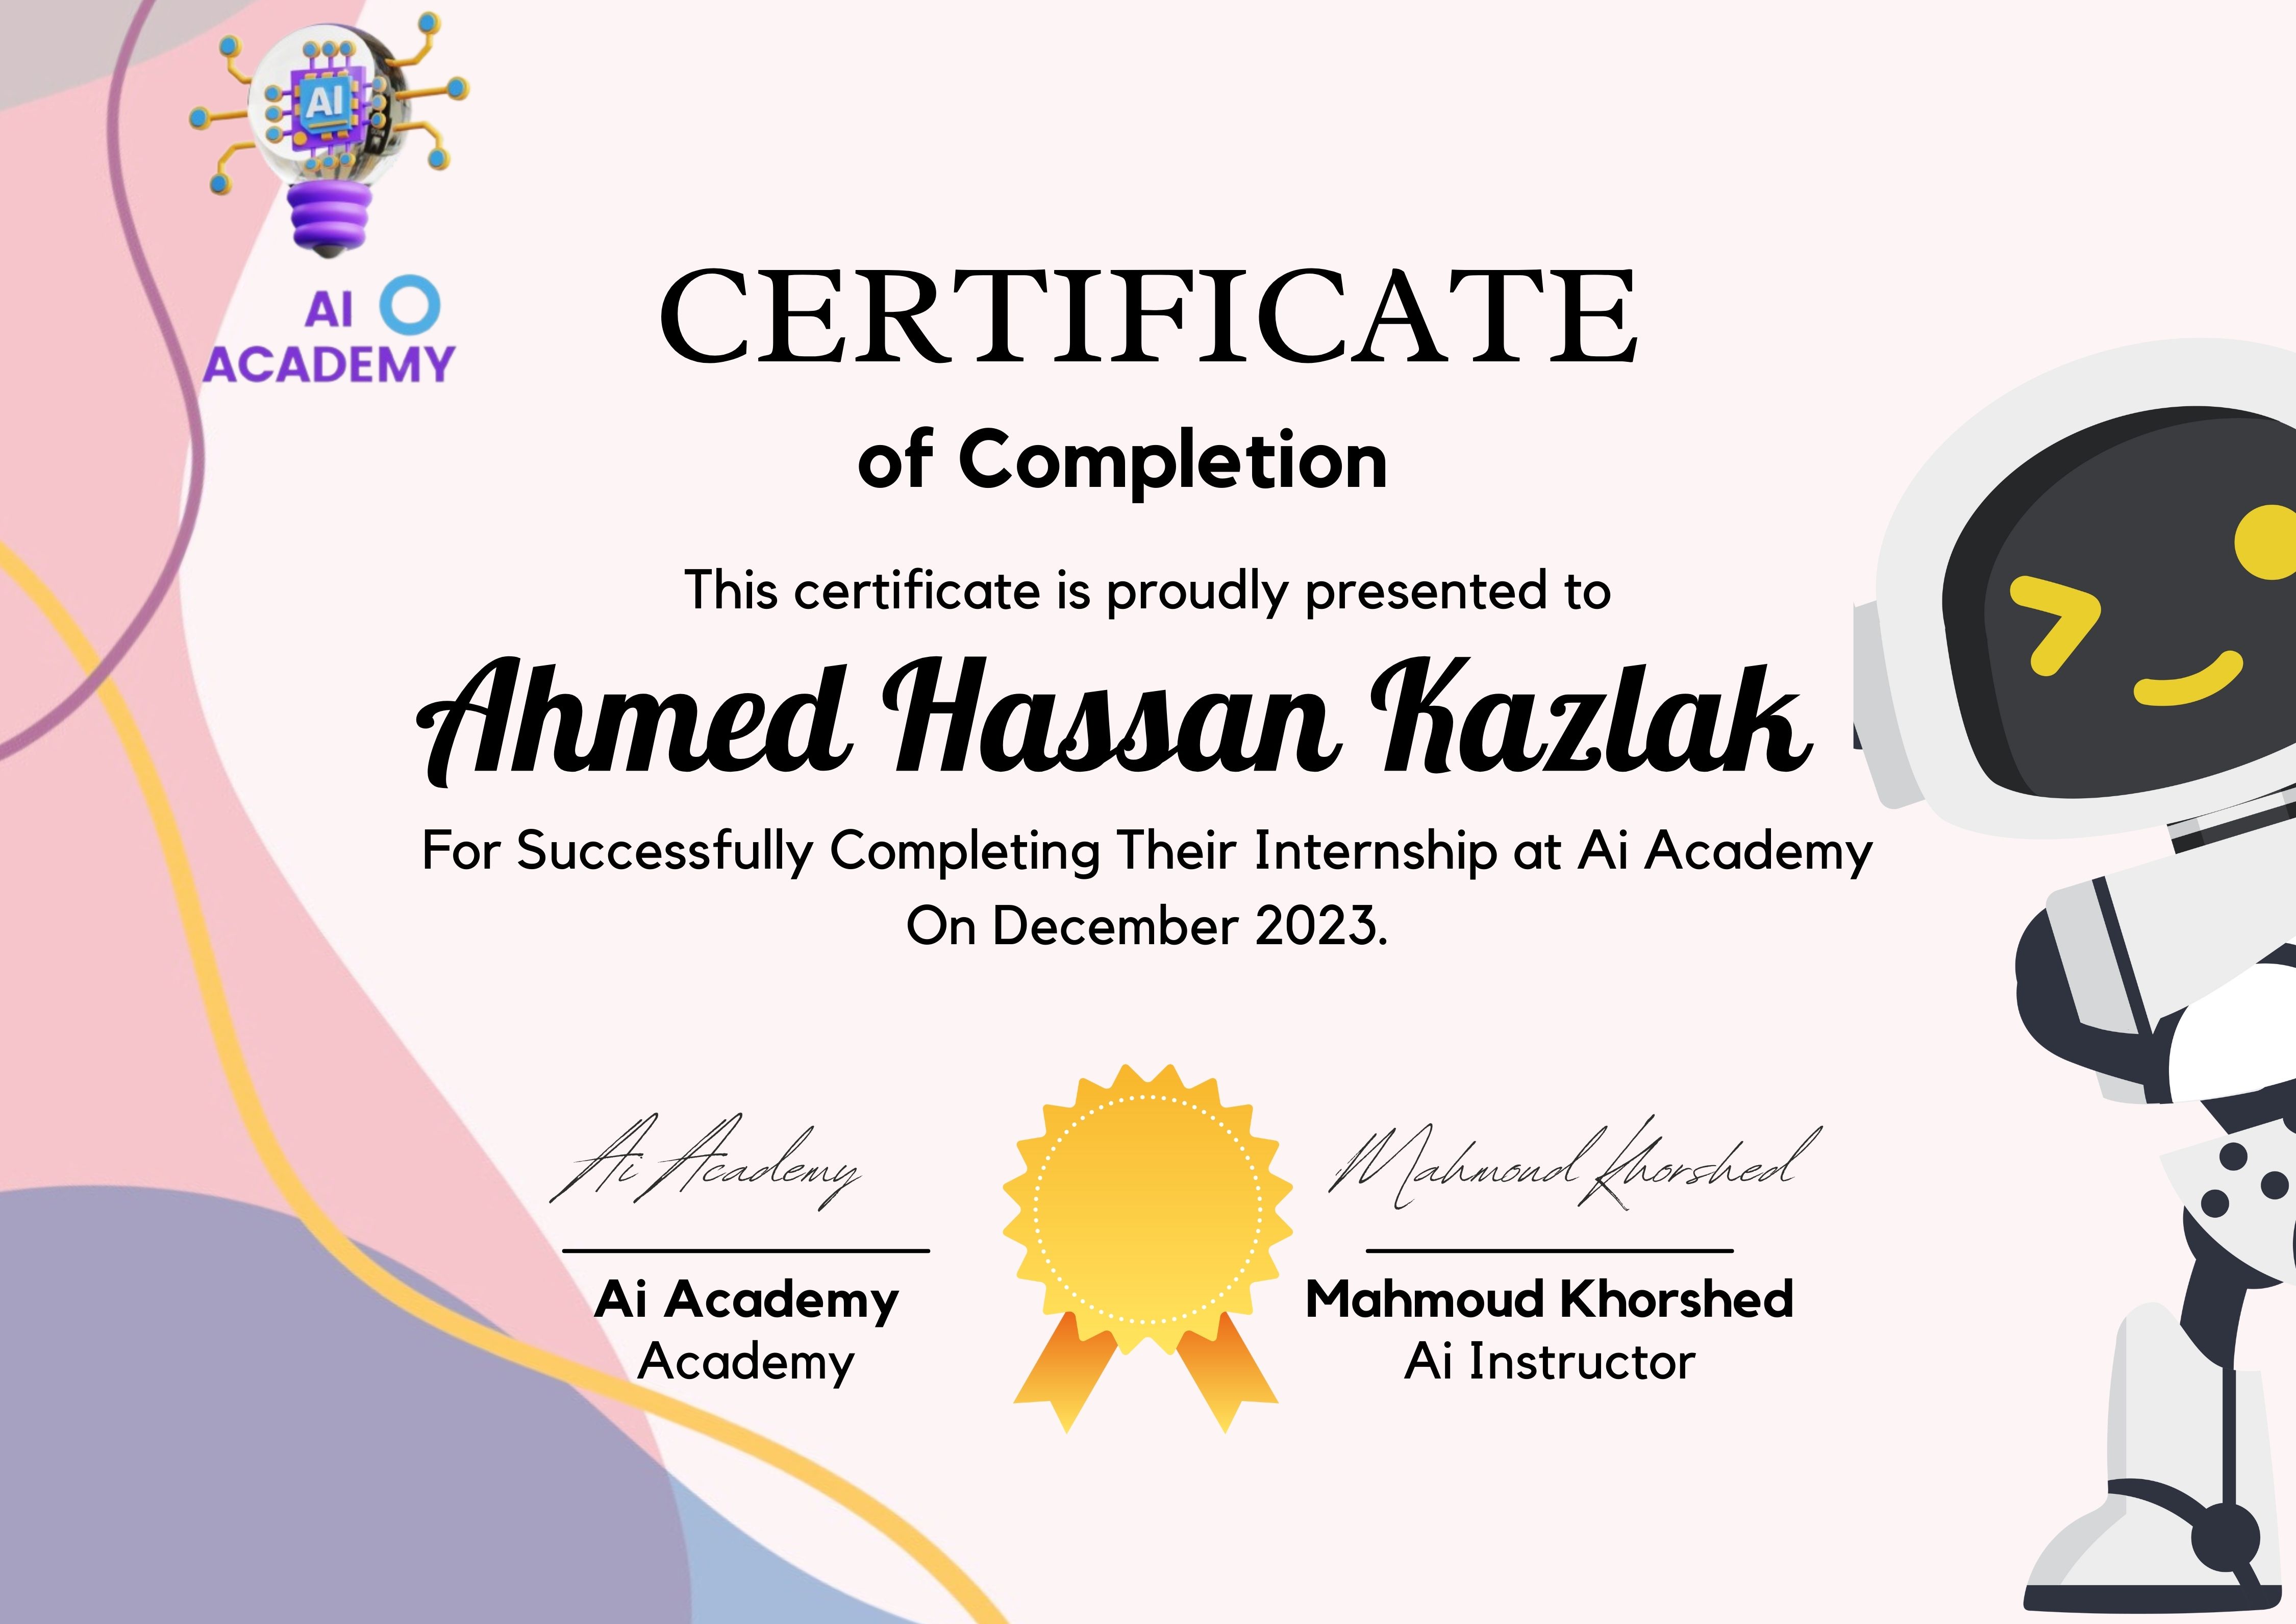
Python Internship

Completed an internship at AI Academy, where I gained foundational knowledge in Python, working with key libraries like Pandas and NumPy. I also developed data visualization skills using Matplotlib and Seaborn, applying these tools to real-world data analysis projects.

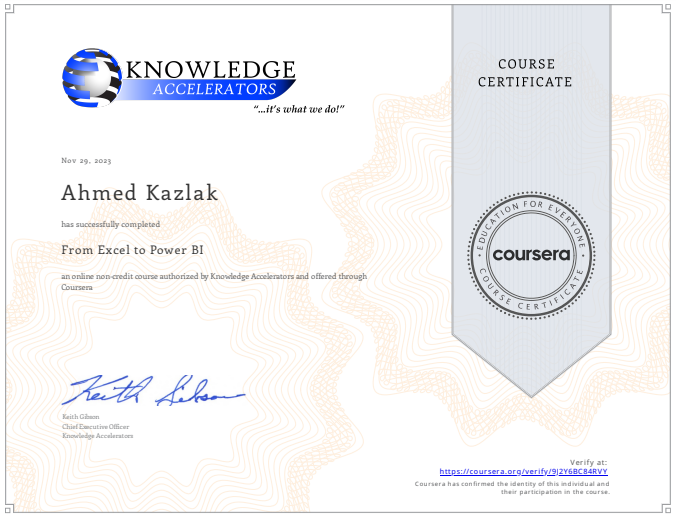
From Excel to Power BI

Completed the From Excel to Power BI course on Coursera by Knowledge Accelerators, where I learned to transition from using Excel to Power BI for data analysis. The course covered the basics of data import, transformation, and creating visual reports in Power BI, providing a solid foundation for building dynamic dashboards.

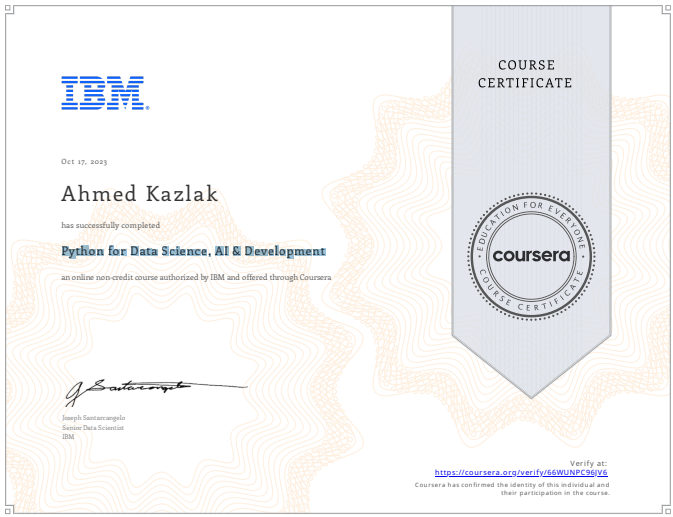
Python for Data Science, AI & Development

Completed the Python for Data Science, AI & Development course on Coursera by IBM, where I learned the fundamentals of Python programming with a focus on data science, AI, and development. The course covered key Python libraries such as Pandas, NumPy, and Matplotlib, and introduced me to data manipulation, analysis, and visualization techniques, as well as basic AI concepts.

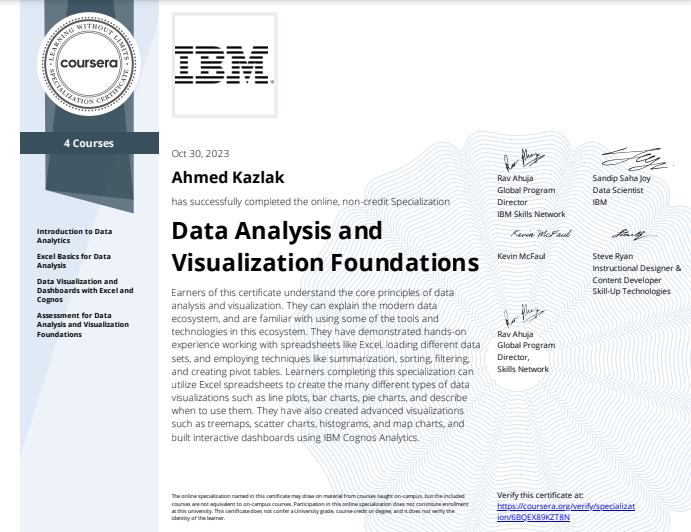
Data Analysis and Visualization Foundations

Completed the Data Analysis and Visualization Foundations course on Coursera by IBM, where I learned the core principles of data analysis and visualization. The course covered tools and techniques like summarization, sorting, and filtering in Excel, as well as creating a range of visualizations such as bar charts, line plots, histograms, and scatter charts. I also gained hands-on experience in building interactive dashboards using IBM Cognos Analytics.

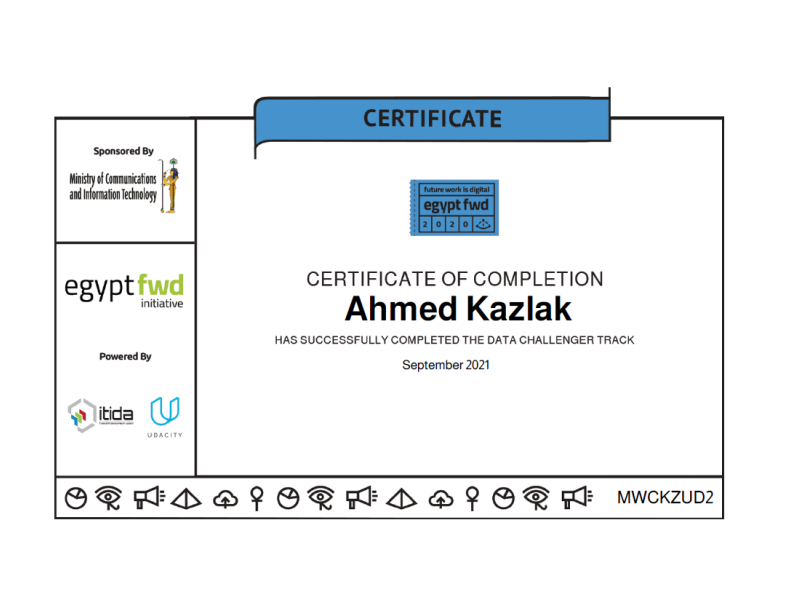
Data Challenger Track

Completed the Data Challenger Track by the Ministry of Communication and Information Technology (MCIT), Egypt, which introduced me to data analysis fundamentals. The course focused on leveraging Excel for data analysis, teaching me key techniques for organizing, analyzing, and visualizing data to derive meaningful insights.

Contact Me

Have a project in mind or want to collaborate? Let’s connect!

Phone

(+20) 127-977-4490

Email

ahmedkazlak5@gmail.com

Links